Lately there have been quite a few thunderstorms raging around. I just wish they had deposited a bit more precipitation here! Plenty of noise but not much action, just like those politicians in Wellington. Just over the hill got 55 mm in the last storm and we were lucky (? ) to catch the edge of it and get 2 mm!!! Calendar year to date is showing some of the lowest rainfall recorded since I bought the farm.
MS production is now 1.26 kg/day/cow, and I am mowing ahead of the girls to keep on top of the seed heads. Just about to take the third cut of silage off the lease block and with the underlying dry conditions I may need it sooner rather than later.
Now that AI has finished the shed routine is a lot more relaxed. I did 4.5 weeks of nominated sires, and then 12 days of SGL. Then things went quiet, so I finished with 6 weeks and two days of mating. All cows cycled naturally, and it will remain to be seen what the empty rate will be with such a short mating. The last cow is due to calve about the 25th August which will give me a tight calving.
As I mentioned in the last blog, I did Overseer FM to look at my greenhouse gas profile. This showed my biggest (and everybody else’s) problem is enteric methane and as we know there is no answer yet for that. Options for the future to reduce emissions were firstly to cut down on imported feed, then use less N fertiliser. This would probably work best as a combination of the two which could give up to a 20% reduction in GHG but about a 10% reduction in EBIT. In my OAD scenario rearing less replacements will also give a reduction of 3% in GHG and a 5% gain in EBIT. Lastly, I could plant more sidlings in trees (pines?) and this has savings in GHG of 6%, but also a loss in EBIT of up to 12%. This is based on a dairy farm case study and could be further tweaked as we learn more, and Overseer is brought up to speed.
I said last time that my water tests were in, and overall I am very happy with the quality of water leaving the farm. Of course, my knowledge of water and swamps and their effects on water quality is limited, so I talked to Bill Vant from Waikato Regional Council. He was very helpful and without his explanations I would have failed to understand my water samples at all. I guess what I am saying here is it is all very well to have samples and records, but an expert is needed to make sense of it all. Once I explained how each watercourse was made up Bill was able to say why I had those readings and what they meant.
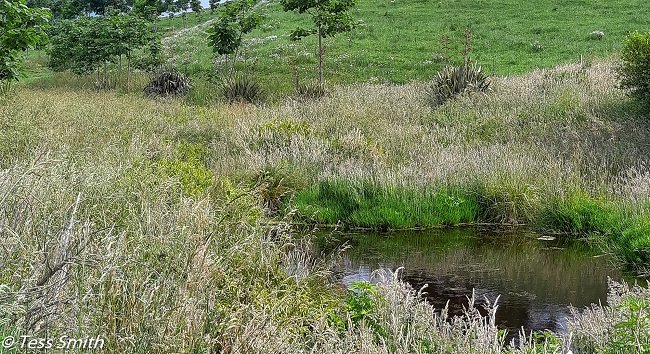
So, my samples showed that my system of water cleaning was working, but unless you can sample the inlet and outlet it is very hard to say how well it is working. Two of my samples were from swamps cleaning a mixture of surface and ground water and they showed that effect in the readings. They showed low to moderate readings and I should be happy with those. The third sample, made up of water coming from a spring, showed high Total N, which reflected the fact that this spring is fed by water from a large catchment which is seeping N into it. This water has been cleaned by the sands it runs through and had low suspended solids and because of that the phosphorus present was in mostly in a dissolved form. This is opposed to one of the swamp samples where you could see the particulate matter (solids) floating in it and therefore the P rating represented those solids. Bill’s parting comment was to inquire if the water had been tested for E.coli. It had not, and this will be requested in the next lot of testing I do.
In summation, there were a lot of things to learn about water and the effects we, and the environment, have on it. Also, get professional advice on the results. Lastly, keep testing so that you build a profile and learn from the changes as you go. Remember that the numbers you get are only relevant to you, which is why I saw little point in printing mine.
Hope you all have a great Christmas and a successful New Year.